Menu
Members Video skillData & Explainers15–60 sec

Data Storytelling · Feed

Turn one checked topic into a hand-drawn chart story for vertical feeds, with a real chart as the camera and a figure-caption subtitle.

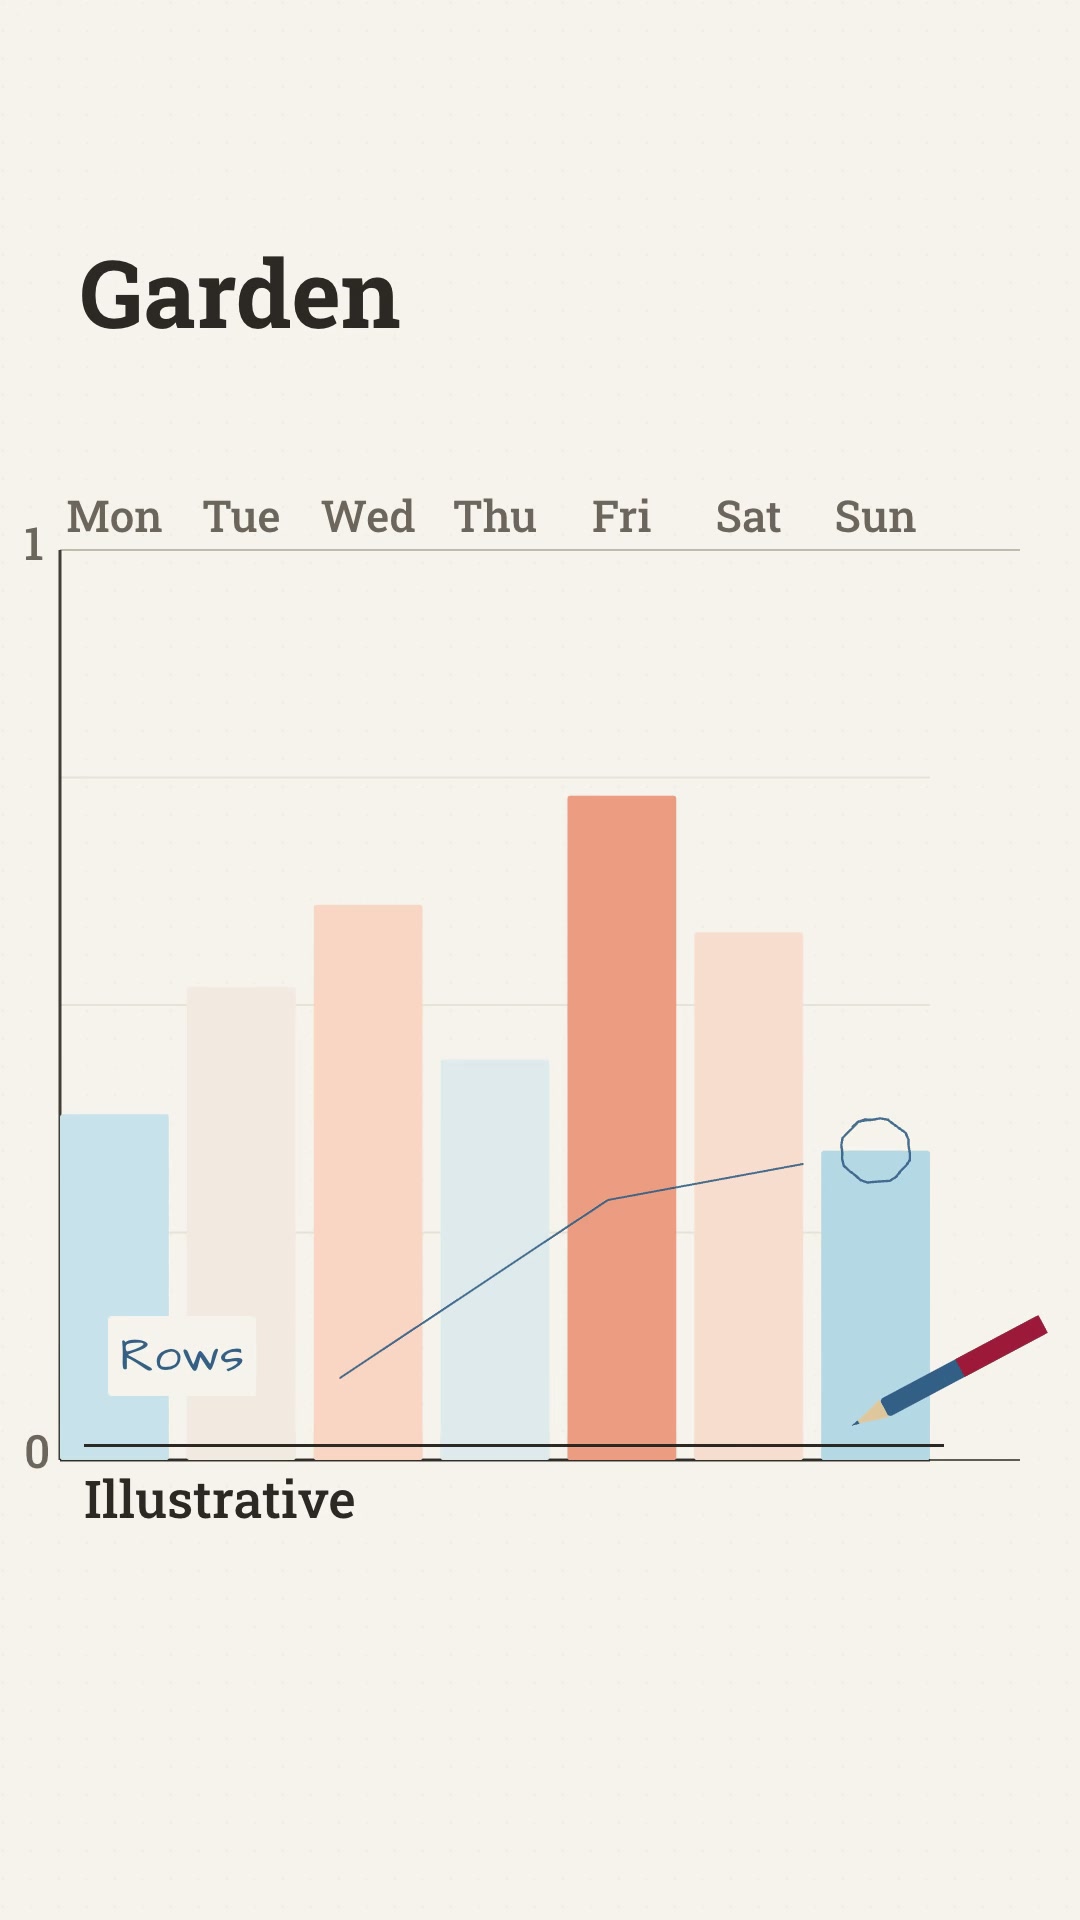
A: 21.4s morning route; B: 21.5s garden water week; both use hand-drawn charts and English Kokoro narration with illustrative values. 9:16 · 0:21

What you get

  • 1080×1920 / 30 fps MP4, cover image, burned captions and captions.srt
  • DOM/SVG-measured layout.json and a scene-level render report
  • Two sample briefs, local Kokoro narration and one-scene incremental rerender proof

You will need

  • Node.js 22+, FFmpeg and FFprobe
  • A checked dataset or an explicit illustrative-demo label
  • The local HyperFrames 0.8.181 cache for rendering
  • An Agent to author and review the chart story

Good fit

  • Small checked datasets
  • Editorial explainers
  • Illustrative chart demos clearly marked as demos

Not for

  • Unverified statistics presented as facts
  • Dashboards with many simultaneous ideas
  • Automatic publishing or third-party media generation

You say

“Use Data Storytelling Feed to make a 20-second vertical chart story about my topic. Keep data provenance explicit in the burned caption when space allows and in generated source-notes.md; use a real chart as the camera, burn English captions, and render a local Kokoro voice track.”

After installing, say something like this to your agent with your own topic and assets. It asks only for what is missing.

FAQ

Do I need an account?

Yes. Members Skills install from a signed-in FeedSkills account with an active Founding Membership.

What does it cost to run?

The Skill is included with Founding Membership. It needs the tools listed under “You will need”. Any voice, model or media service you choose bills you directly; FeedSkills does not include provider credits.

Can I use the videos commercially?

Videos you make are yours to use, including commercially. The Skill package is licensed as: FeedSkills Source-Available License 1.0 · upstream MIT preserved. Fonts, music, footage and services you add keep their own terms.

Which agents does it work with?

Agents that read SKILL.md files, such as Codex or Claude Code. What FeedSkills has actually tested is listed under Tested scope below.

Tested scope

Version
0.1.2
Acceptance
This version has a recorded acceptance entry.
Tested
Two English chart examples (21.4s/21.5s) and a one-scene edit checked with real SVG values, DOM measurements, full-stream decode, audio and frame/PCM checks. Package tests verify numeric mark heights and label clearance.
Runs on
Codex · macOS · Node.js 22+ · FFmpeg
License
FeedSkills Source-Available License 1.0 · upstream MIT preserved

Details

What this is

Data Storytelling Feed makes one checked topic into a hand-drawn chart story. The chart is the camera, values land as measured marks, and a figure-caption subtitle keeps the narrative focused instead of becoming a dashboard.

Inputs and outputs

Provide one checked dataset, or label every number as illustrative demo data, plus a short story brief and stable scene ids. The Skill produces an editable project, a 1080×1920 MP4, cover image, burned captions, captions.srt, measured layout.json, and a scene render report.

A/B examples
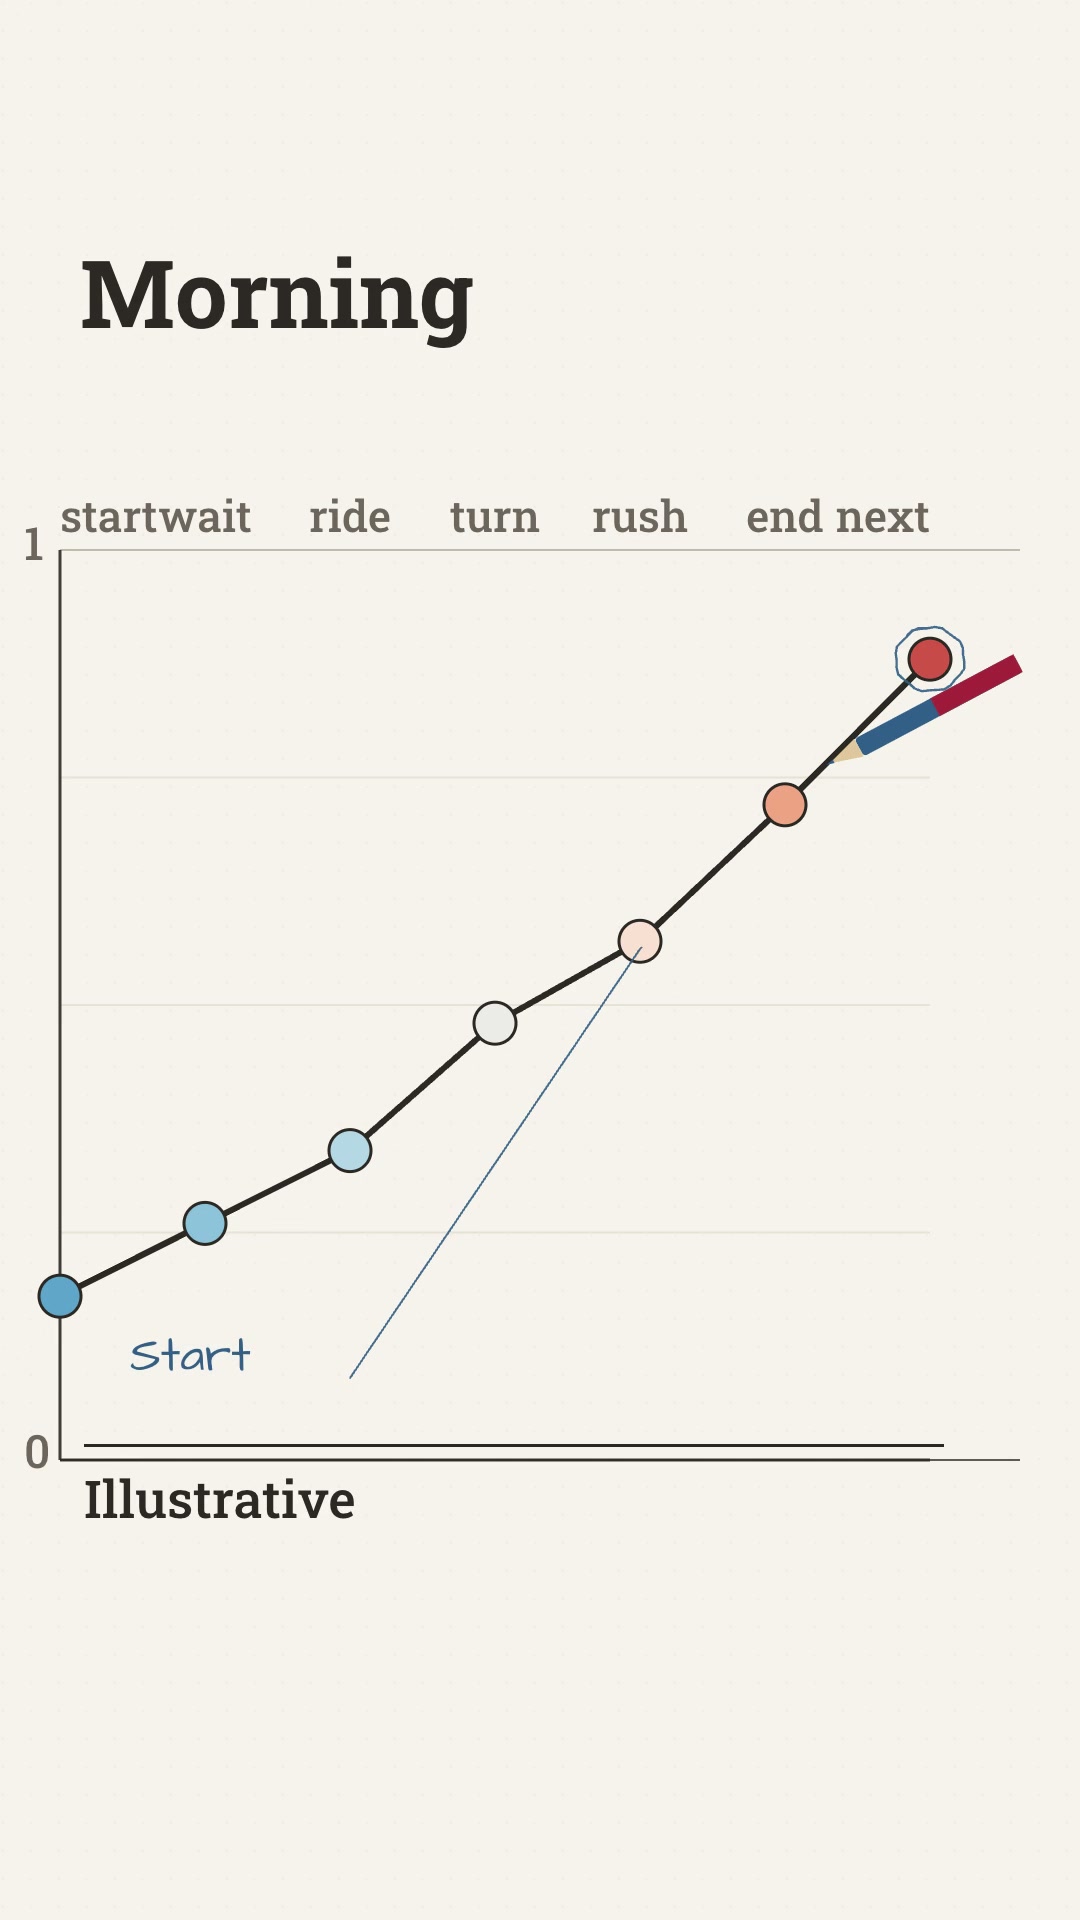
Theme A is a 21.4-second illustrative morning route. Theme B is a 21.5-second illustrative garden water week. Both use hand-drawn charts and English narration; the values are demo data and must not be generalized to another topic.

Runtime and dependencies

Use Node.js 22+, FFmpeg/FFprobe, HyperFrames 0.8.181 with its local browser cache, and local Kokoro narration when enabled. Keep data provenance in the source notes and review every number before sharing.

Source and license

The chart grammar references LemoLab Dataviz at pinned commit b5e8ef93930b6d828f352055a689320f138237b1, under MIT. The package retains the upstream notice and FeedSkills terms in LICENSE and THIRD_PARTY_NOTICES.md.

Access boundary

This is a Members Skill. The Skill package is delivered privately to active members; examples show workflow shape, not a claim about any arbitrary dataset or customer result.