Two data-story studies
Data Story Motion Pack turns a question, exact values and one turning point into two measured vertical English studies. The examples keep their Illustrative demo boundary rather than presenting invented numbers as real-world claims.
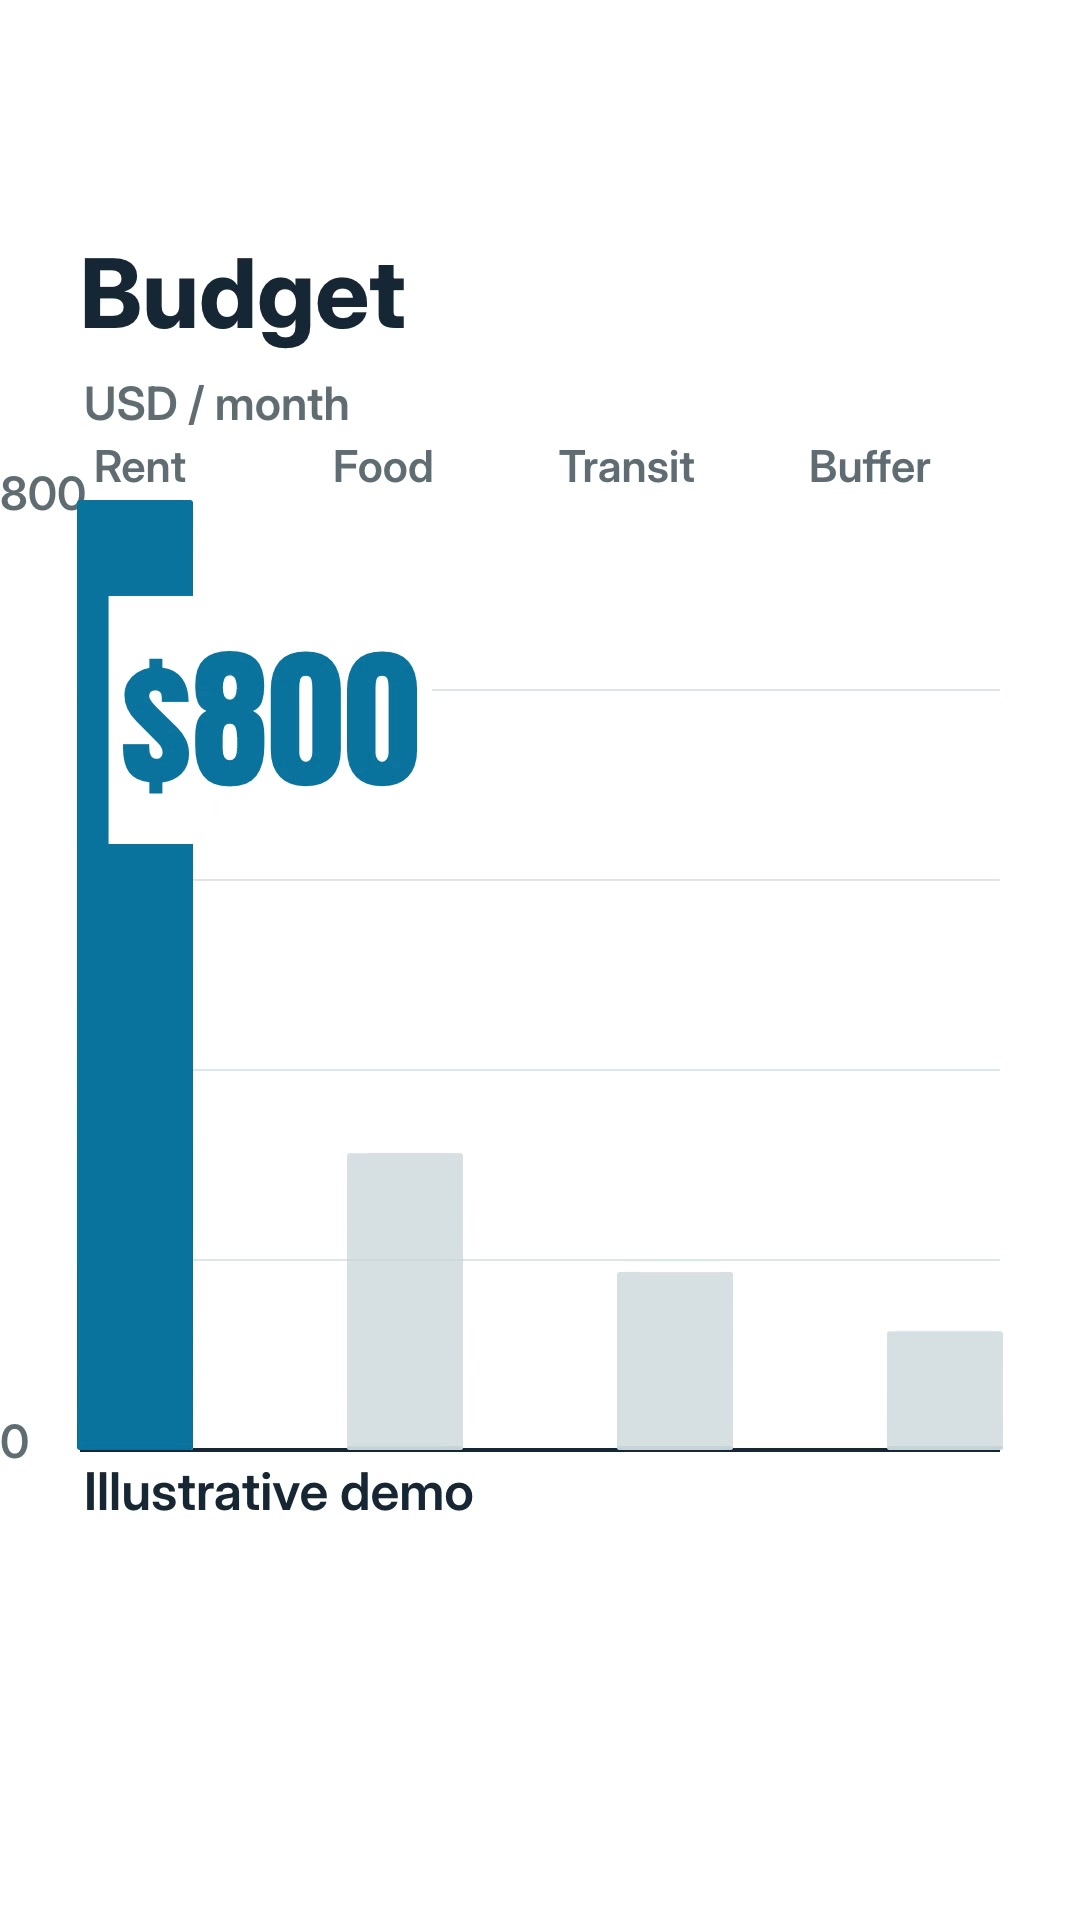
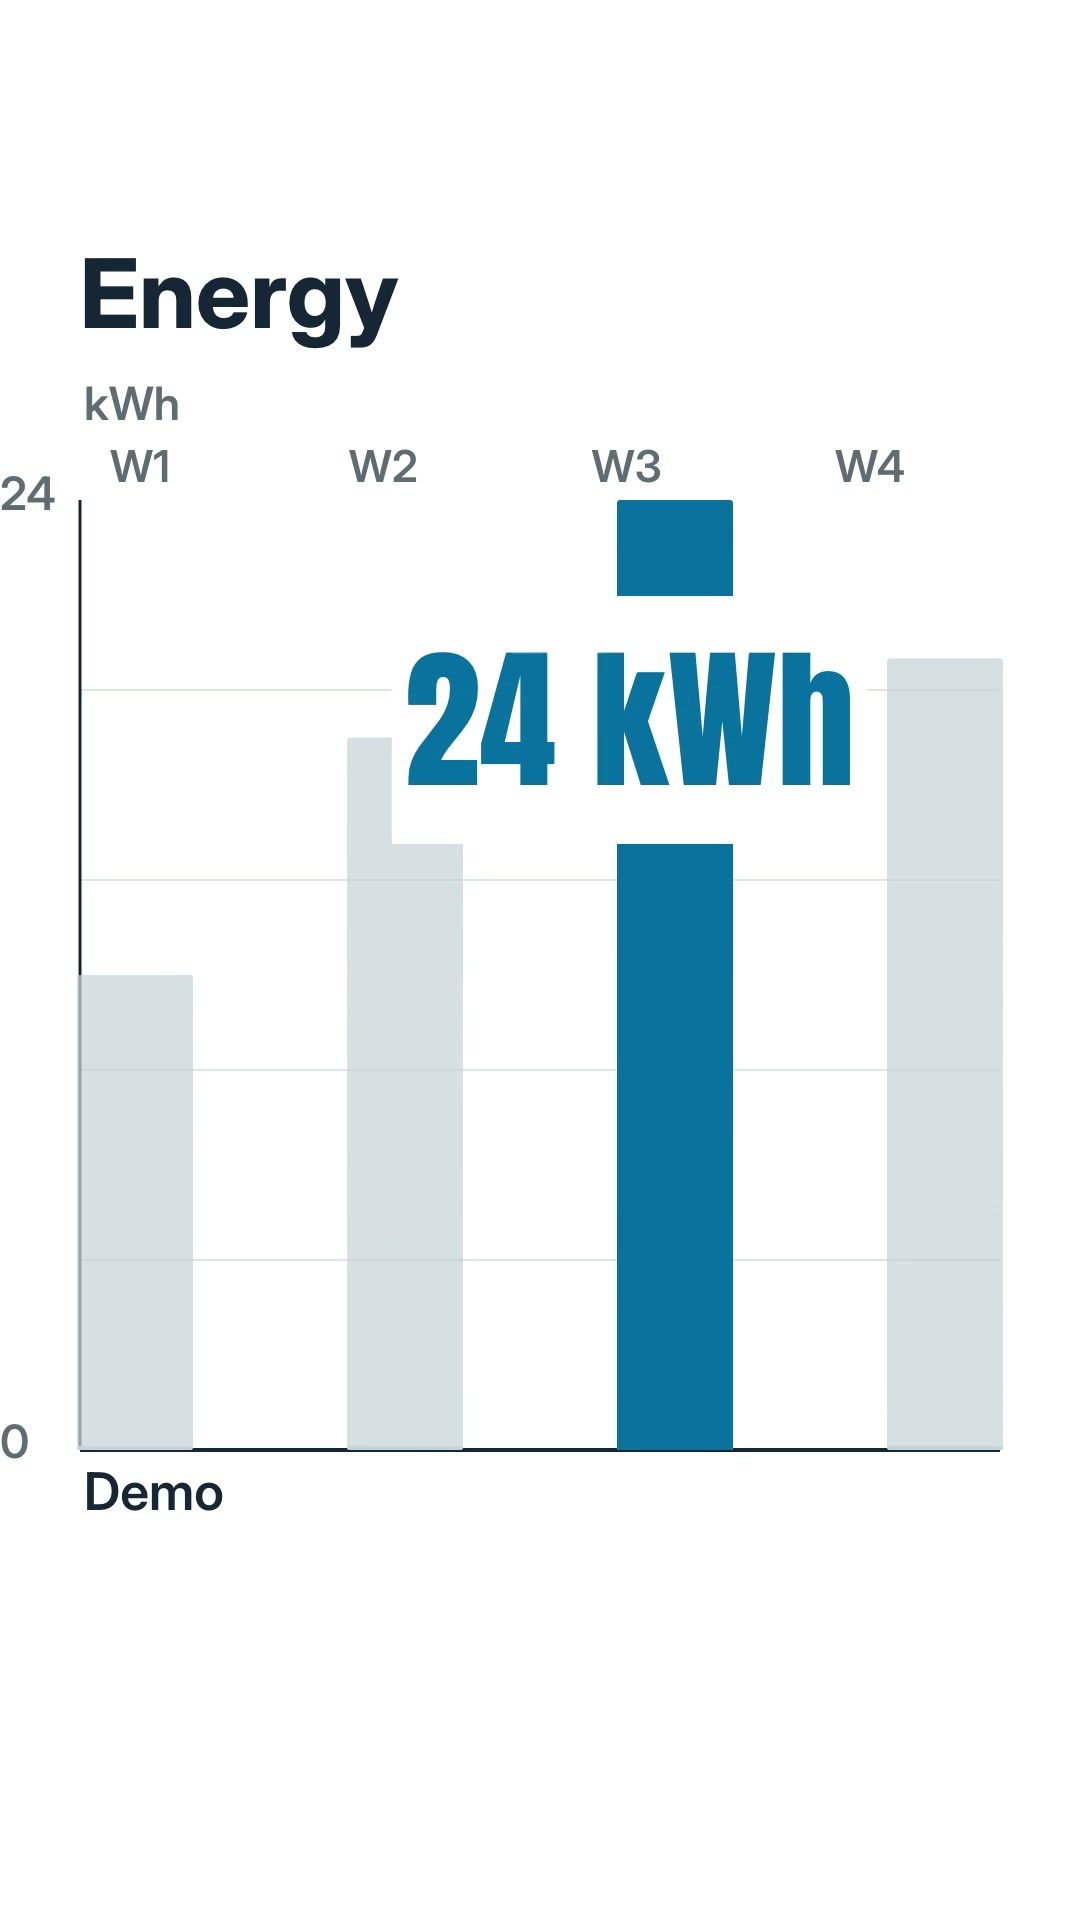
Use the workflow
Start from examples/theme-a.json or examples/theme-b.json, then replace the illustrative values with a checked source and an explicit claim scope. The engine authors charts, axes, labels and annotations as SVG; it exports a 1080×1920 MP4, cover, burned captions, captions.srt, measured layout.json and a render report. Scene IDs are stable so a one-scene edit can reuse untouched segments.
No external media is required. Use local Kokoro for English narration, or choose the documented silent boundary. Replace the illustrative values with a checked source before making a factual claim.
Source, runtime and access
The finance-chart grammar reference is Huashu Motion at pinned commit 52467f99c602b76ba86d511d37acdfe93fa1e16e, under MIT. FeedSkills’ SVG engine is its own implementation; the upstream runtime and reference media are not distributed. Node.js 22+, FFmpeg/FFprobe, HyperFrames 0.8.181 and a local Kokoro environment are separate runtime dependencies. Bundled Inter and Anton fonts retain their SIL OFL notices.
This is a Members Skill. An active Founding Membership is required; the public catalog exposes the summary and example routes only. Use a checked dataset for factual stories and keep the illustrative boundary visible when using the supplied examples.